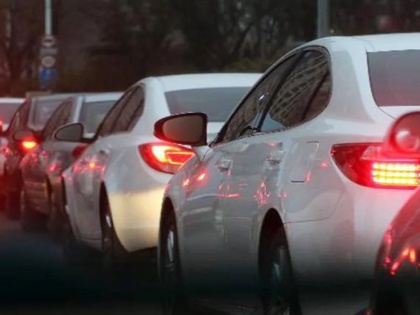
Bengaluru Once Again Tops Congestion Charts in India; Mumbai and Pune at THESE Spots
By Lokmat English Desk | Published: February 4, 2024 09:30 AM2024-02-04T09:30:45+5:302024-02-04T09:31:21+5:30
A recent report by Amsterdam-based location technology specialist TomTom revealed that London, the UK capital, earned the dubious distinction ...

Bengaluru Once Again Tops Congestion Charts in India; Mumbai and Pune at THESE Spots
A recent report by Amsterdam-based location technology specialist TomTom revealed that London, the UK capital, earned the dubious distinction of being the slowest city to drive through in 2023, with an average speed of 14 kmph during rush hours. The TomTom Traffic Index assessed 387 cities across 55 countries, considering average travel time, fuel costs, and CO2 emissions.
Two Indian cities, Bengaluru and Pune, found themselves on the list of cities grappling with the worst traffic conditions globally. In Bengaluru, the average travel time per 10 km in 2023 was 28 minutes and 10 seconds, earning it the sixth spot on the list. Pune closely followed at seventh place, with an average travel time of 27 minutes and 50 seconds.
Bengaluru, known as the IT capital of India, was additionally crowned the second most congested city worldwide in 2023, trailing behind Dublin, the capital of Ireland. The worst day for travel in Bengaluru was recorded on September 27, with an average travel time of 32 minutes for a 10 km journey.
In Pune, the sixth most congested city globally, the peak traffic day was noted on September 8, with a travel time of approximately 34 minutes for a 10 km distance.
Delhi and Mumbai, major Indian metropolises, also faced traffic challenges, ranking 44th and 52nd, respectively, on the TomTom Traffic Index. In Delhi, the average time to cover 10 km was 21 minutes and 40 seconds, while in Mumbai, it stood at 21 minutes and 20 seconds.
London topped the list as the city most severely impacted by traffic in 2023, with an average travel time of 37 minutes for a 10 km journey. Dublin followed closely with an average travel time of 29 minutes and 30 seconds, securing the second spot, while Toronto in Canada claimed the third position with 29 minutes for a 10 km distance.
Notably, the report highlighted that in London and Dublin, travel times for approximately a 9-km journey increased by +1 minute compared to 2022.
Overall, in 2023, the average speed decreased in 228 of the 387 cities analyzed in the traffic index compared to 2022, according to TomTom. Of these, 82 cities witnessed no change in their average speed, while 77 cities experienced higher average speeds and shorter journey times than in 2022. Furthermore, in over 60% of the 351 cities where fuel prices were aggregated, the average fuel budget increased by 15% or more between 2021 and 2023.
Open in app